ESP32 — ESP-IDF v6
VS Code Integration — ESP-IDF
Visual Studio Code with the ESP-IDF extension gives you a complete IDE experience — IntelliSense, one-click build/flash, an integrated serial monitor, and JTAG debugging.
Prerequisites
- VS Code installed (code.visualstudio.com)
- ESP-IDF v6.0.1 installed via EIM — Windows Setup →
- Your board connected via USB with drivers installed
- COM port identified from Device Manager (e.g.,
COM3)
Install ESP-IDF via EIM first
The VS Code extension does not install ESP-IDF on its own. Complete the Windows Setup guide before continuing here.
Step 1 — Install VS Code
Download from code.visualstudio.com.
On Windows — choose the System Installer, not the User Installer. This avoids permission issues with ESP-IDF build tools.
Step 2 — Install the ESP-IDF Extension
- Open VS Code
- Press
Ctrl+Shift+Xto open the Extensions panel - Search for "ESP-IDF"
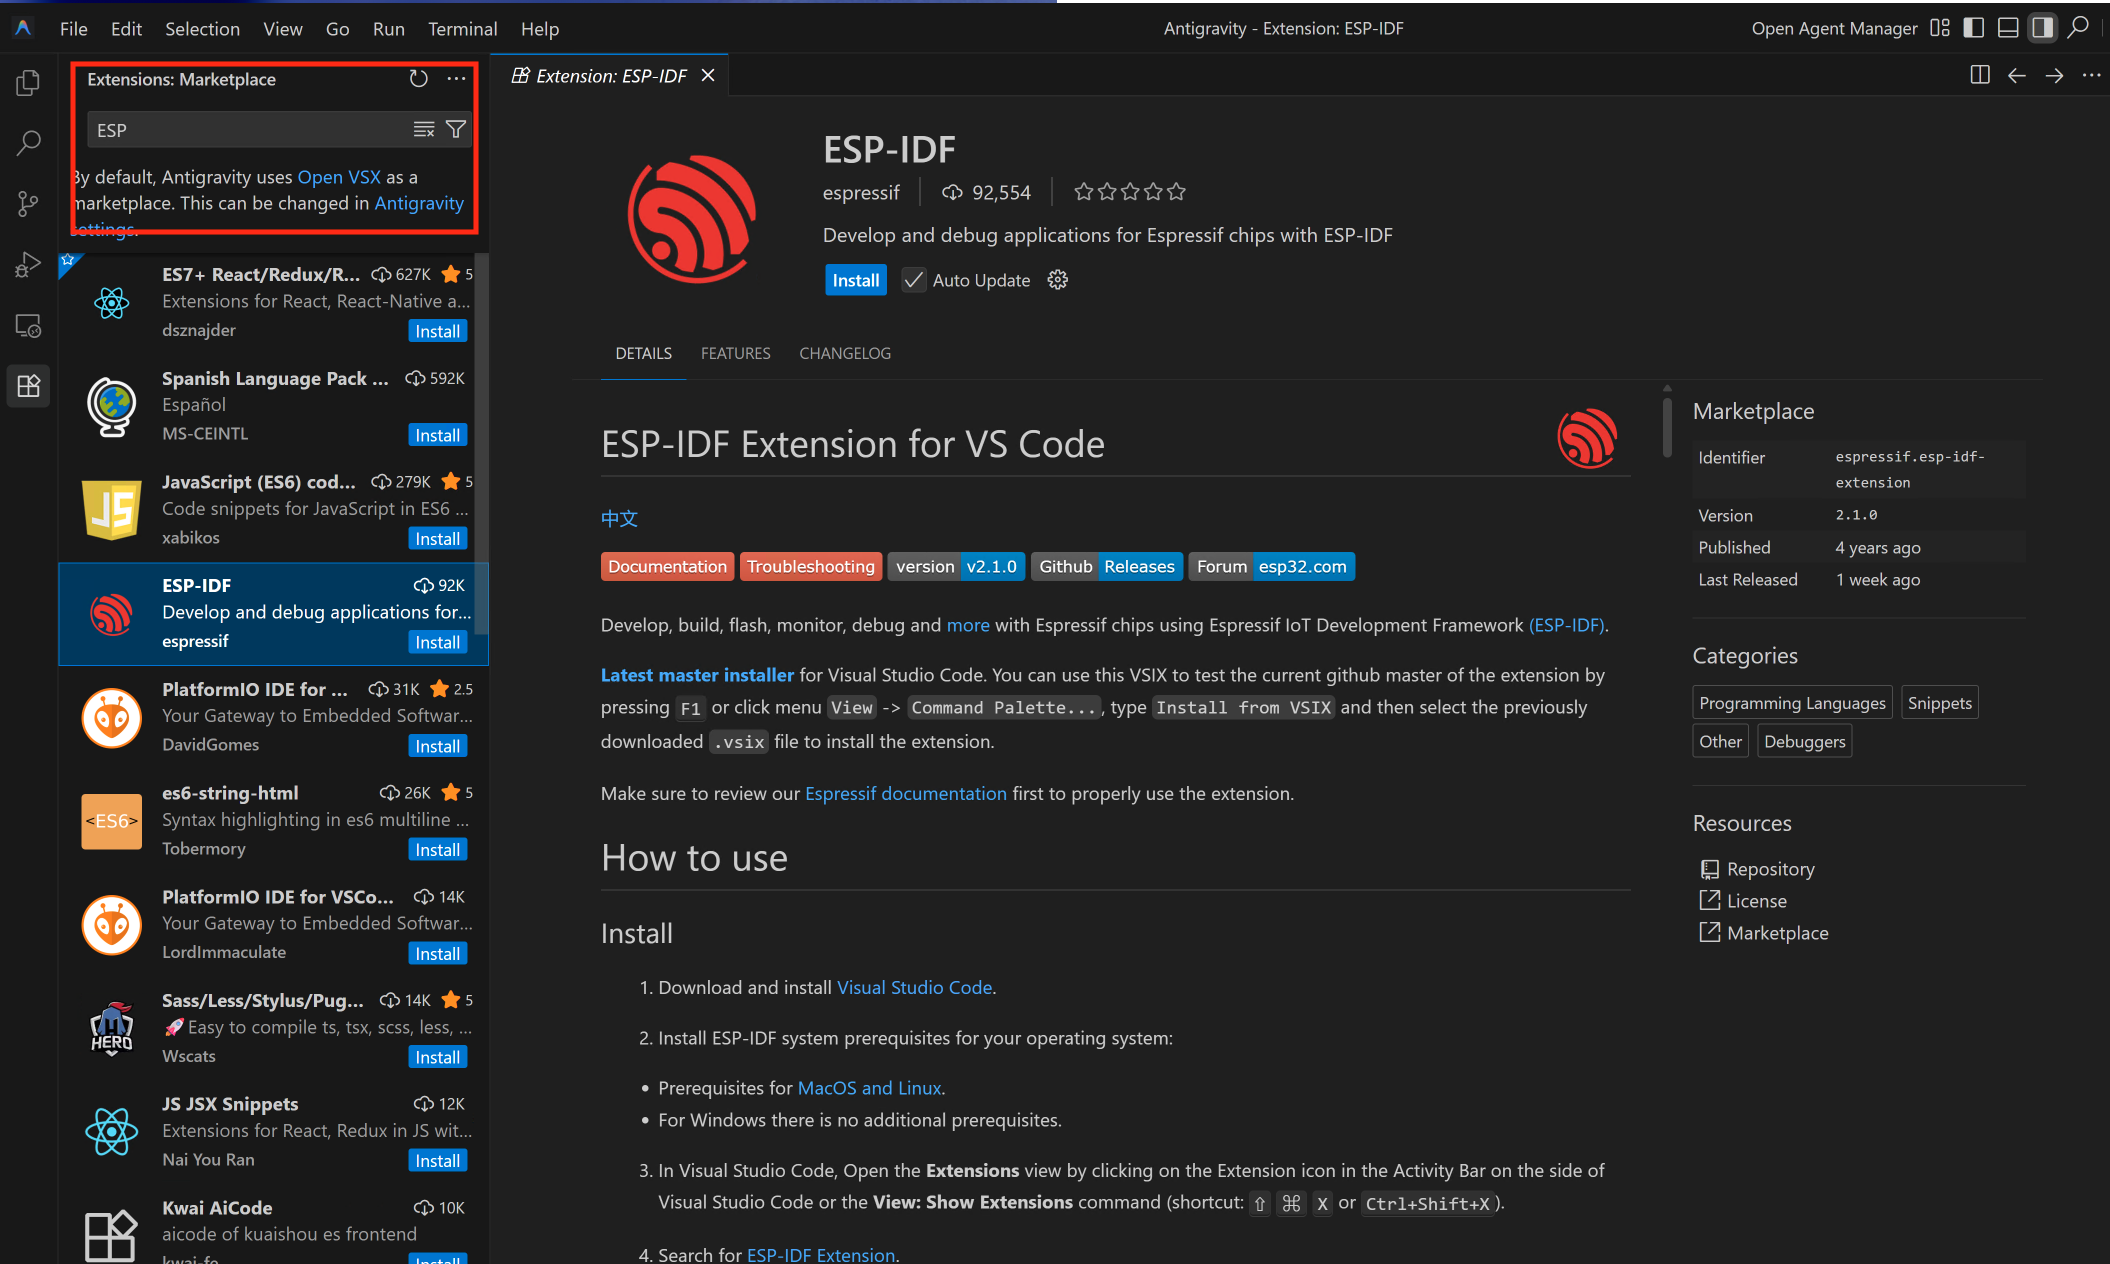
- Install the extension by Espressif Systems
Install the correct extension
Make sure the publisher is Espressif Systems — extension ID espressif.esp-idf-extension. There are similar-looking extensions from other publishers — install the official one only.
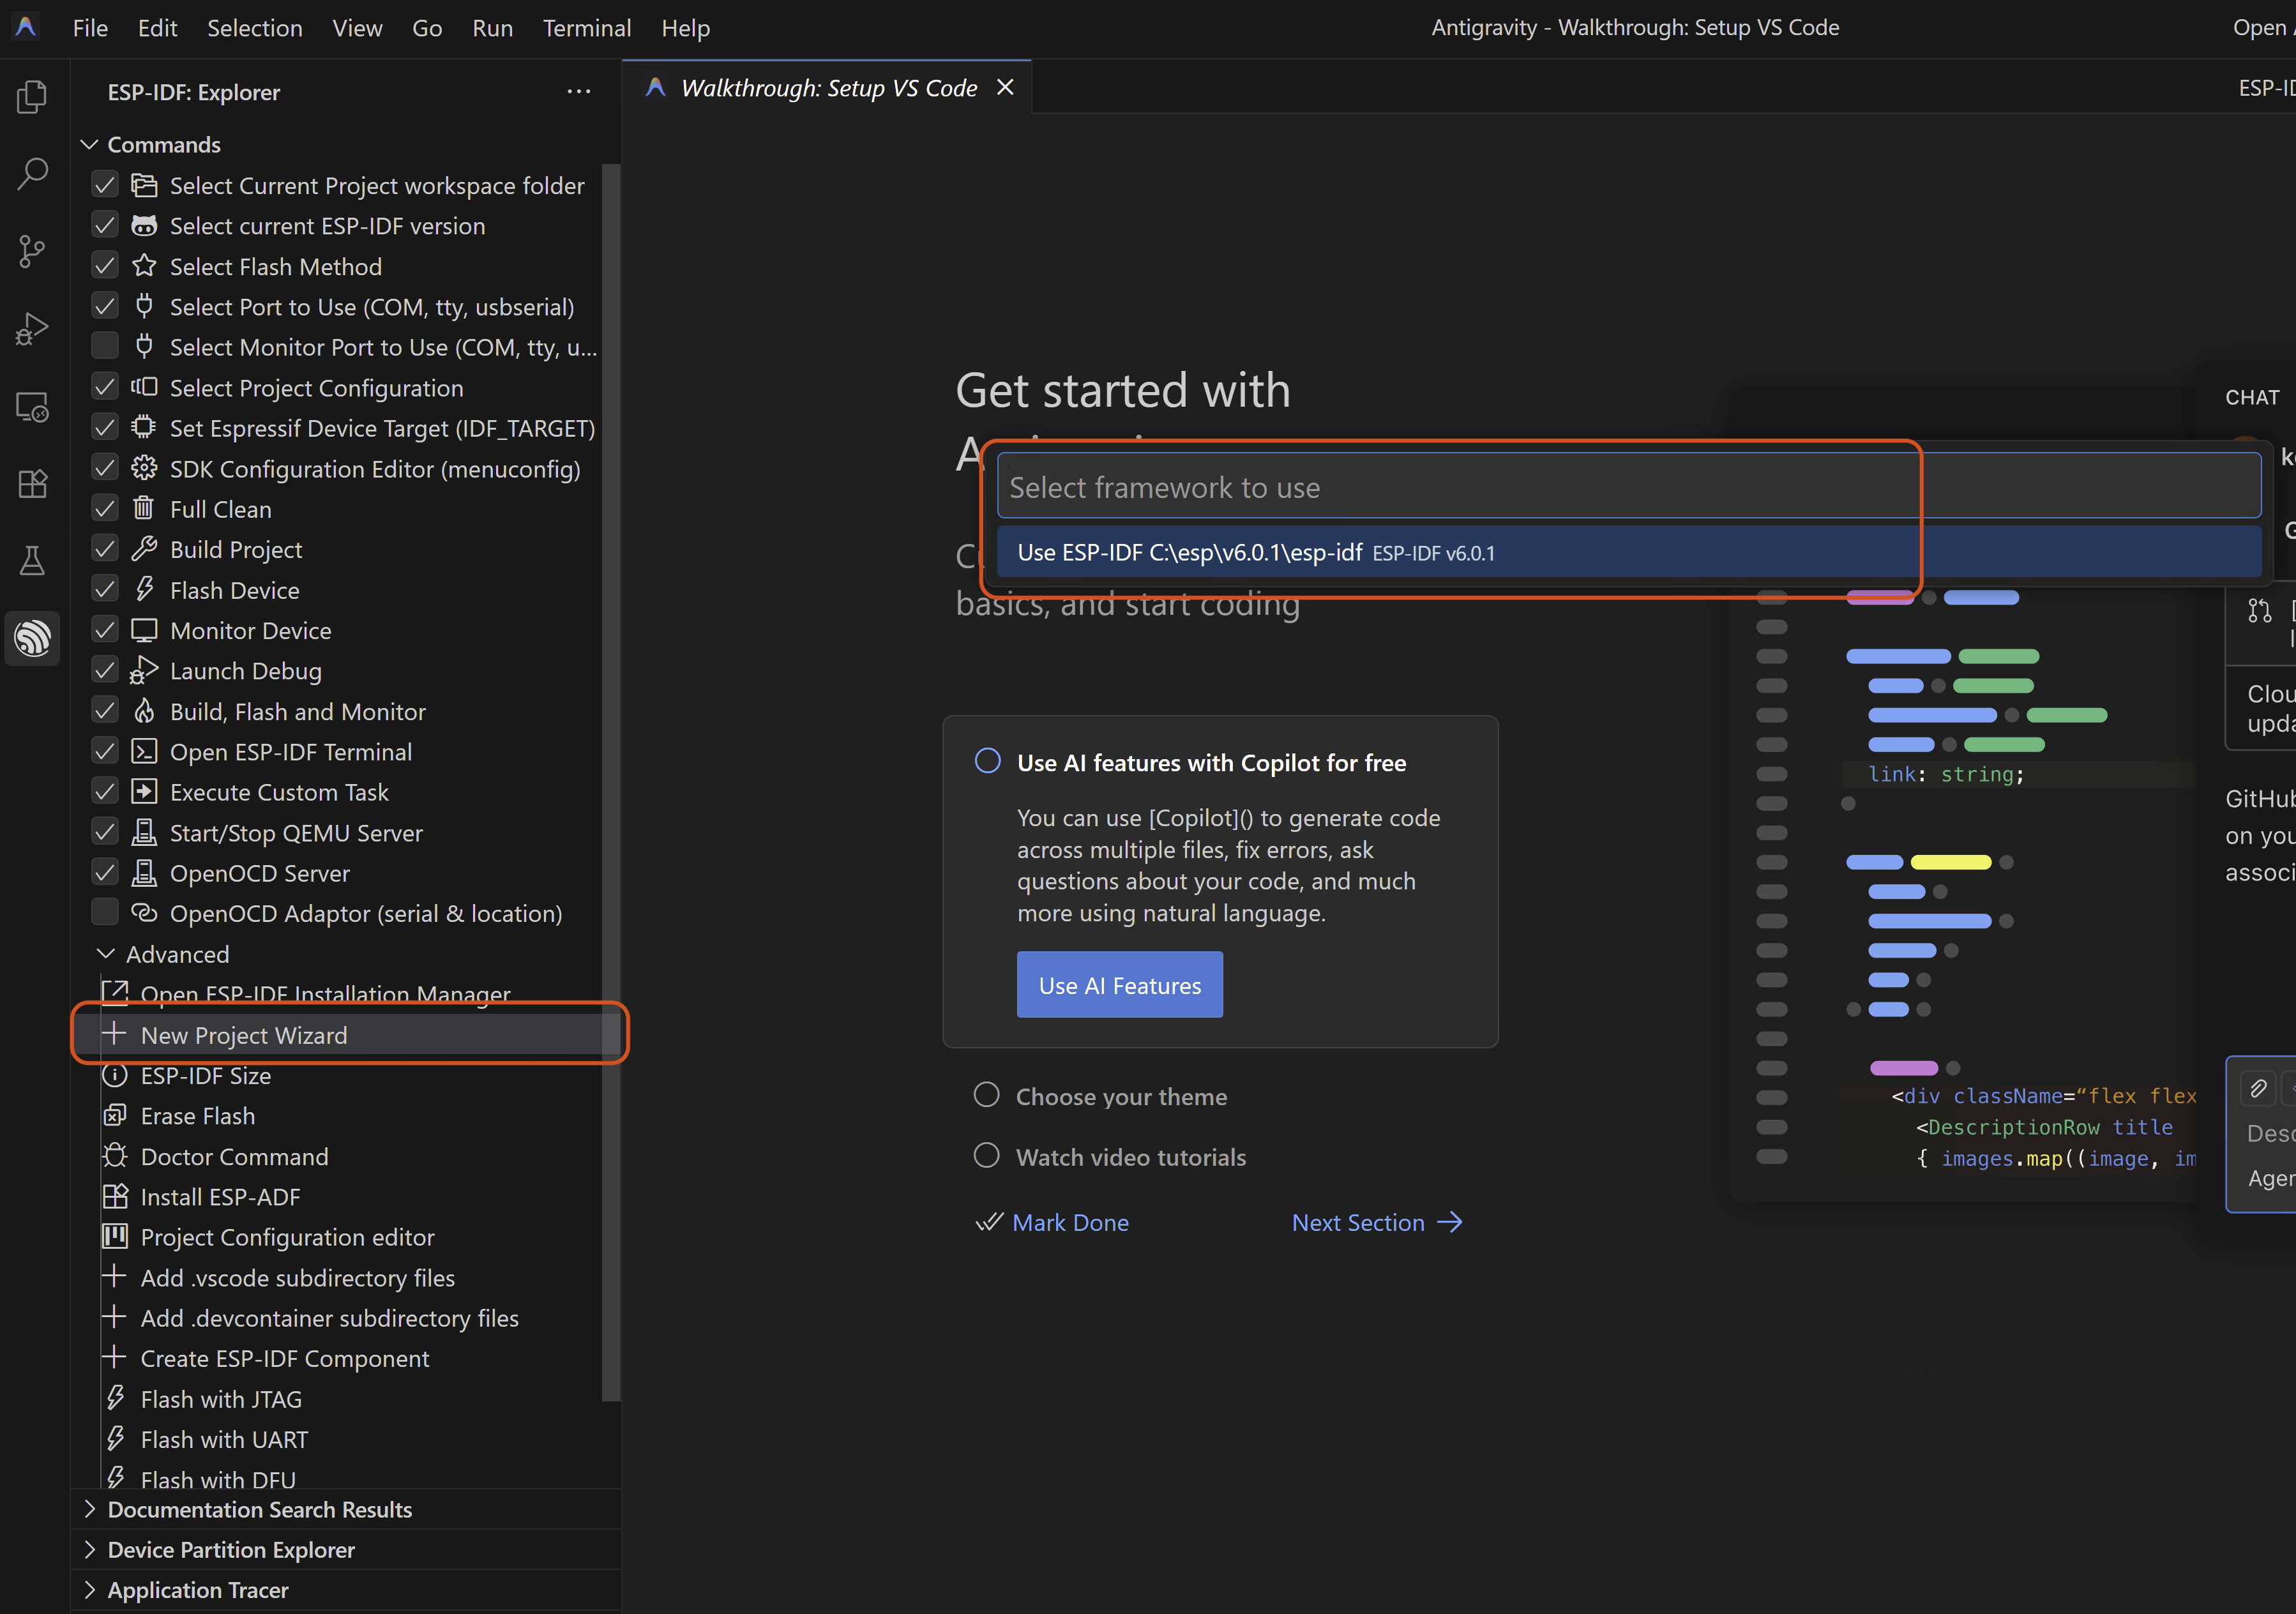
Step 3 — Point the Extension to Your ESP-IDF Installation (Optional)[This Set's Automatically in v6.0.1]
Since ESP-IDF v6.0.1 is already installed via EIM, you just need to select it:
Open the Command Palette (Ctrl+Shift+P) and run:
ESP-IDF: Select Current ESP-IDF Version
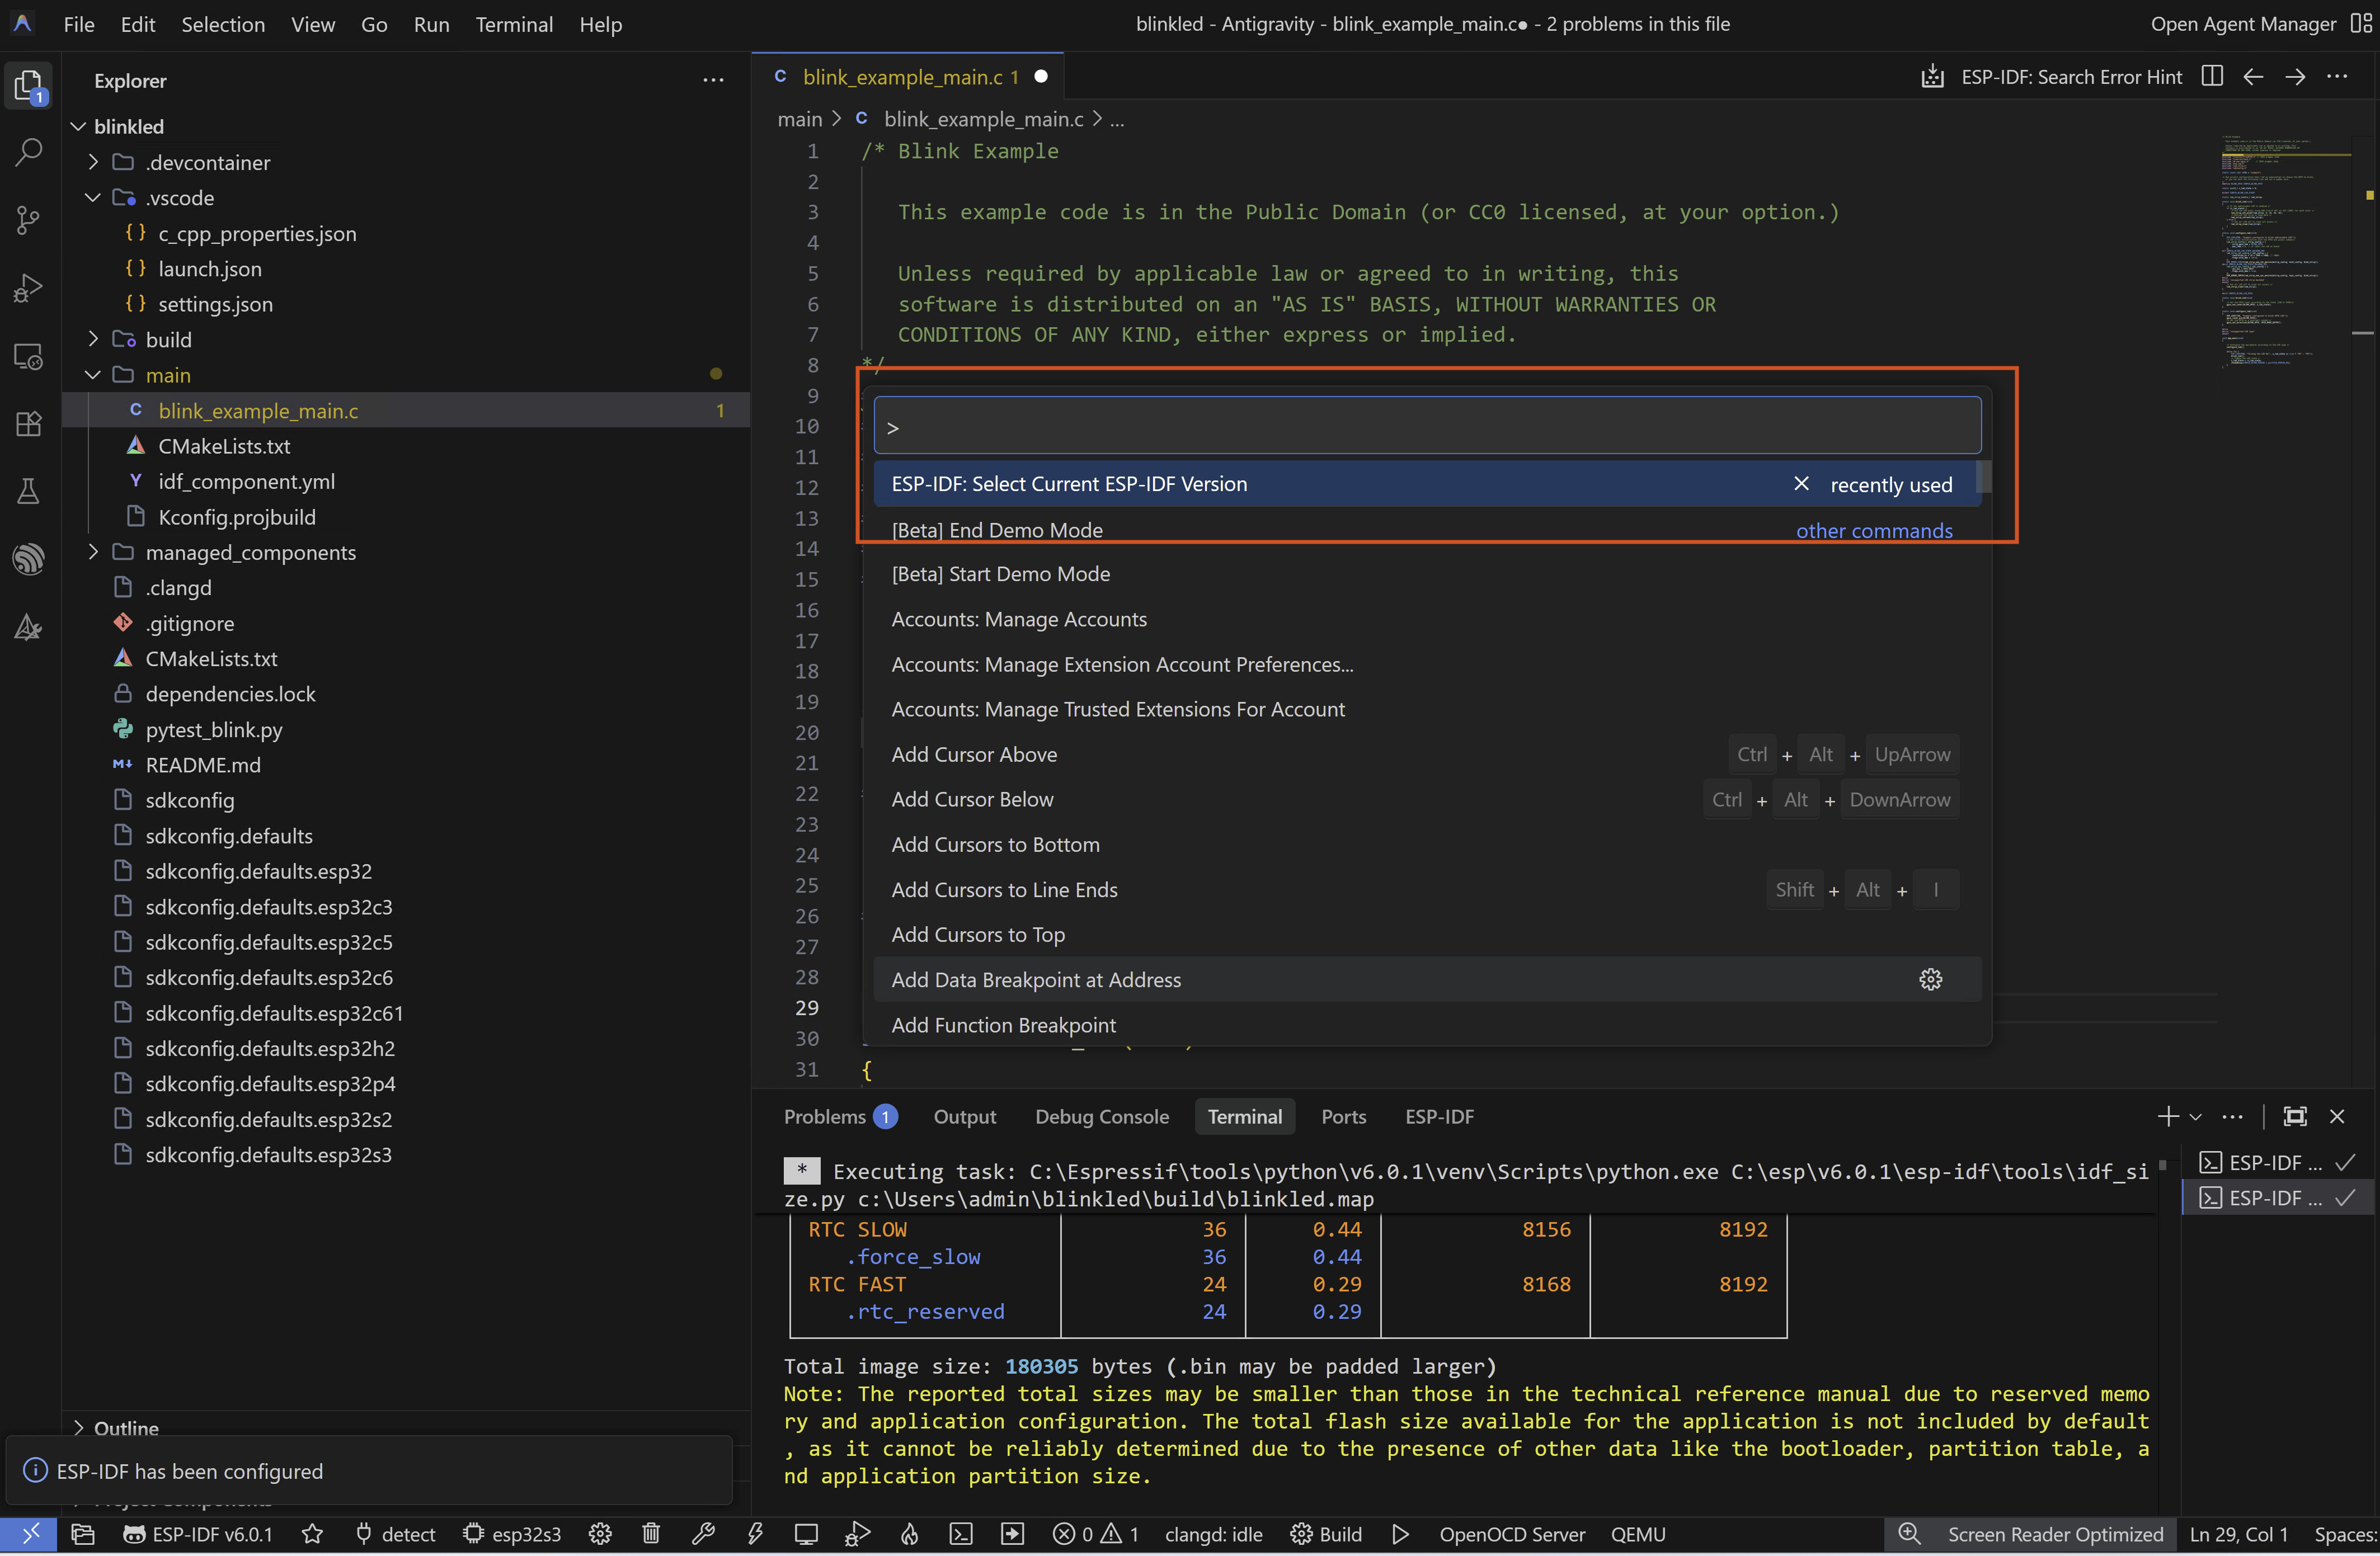
A dropdown appears showing all ESP-IDF versions detected on your machine. Select ESP-IDF v6.0.1.
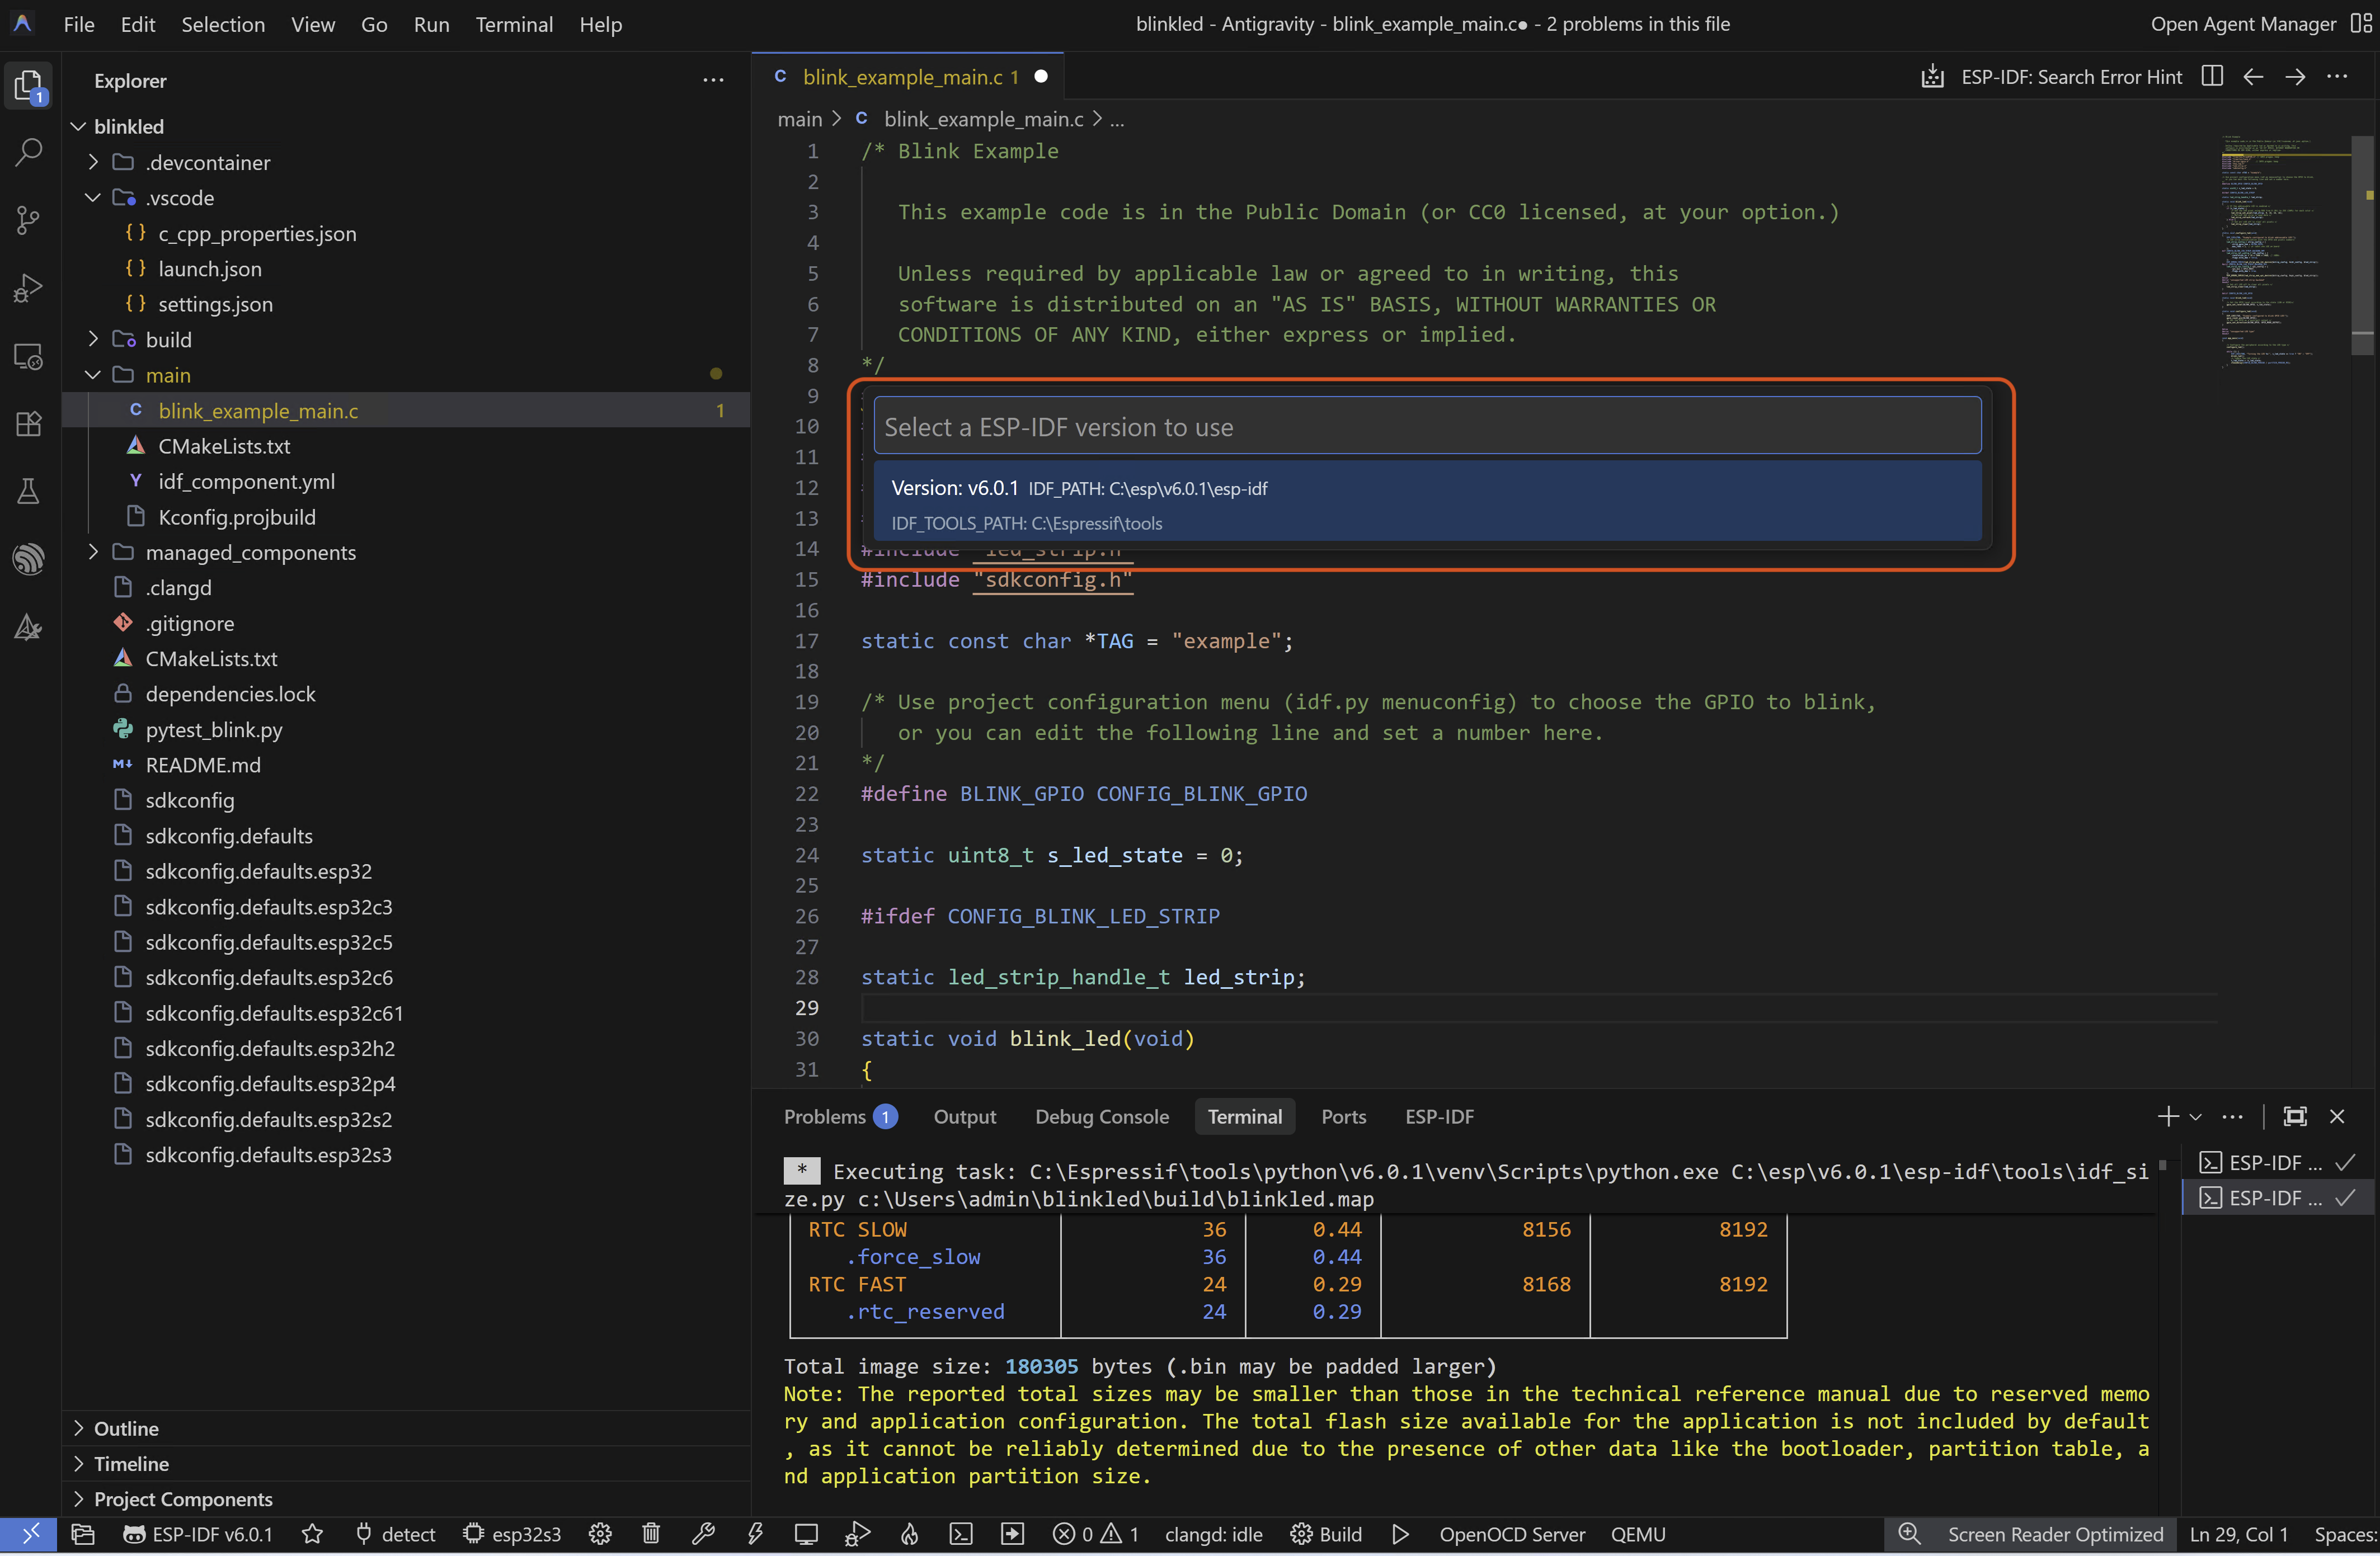
The extension saves this as the active setup for your current workspace.
Verify the setup
Run ESP-IDF: Doctor Command from the Command Palette to confirm everything is configured correctly. You should see green OK status for ESP-IDF, Python, CMake, Ninja, and OpenOCD.
Multiple versions
If you have multiple ESP-IDF versions installed via EIM, you can switch between them anytime using ESP-IDF: Select Current ESP-IDF Version. Each workspace can use a different version independently.
Step 4 — Open Your Project [Optional - you can create a new project using the extension also - See below]
File → Open Folder → select your project directory
The extension automatically detects CMakeLists.txt and configures IntelliSense for all ESP-IDF headers.
To create a new project instead of opening an existing one:
- Press
Ctrl+Shift+P - Type
ESP-IDF: New Project - Select a template — use
get-started/hello_worldfor a basic test - Set project name, location (no spaces in path), and target chip
- Click Create Project → Open Project
Step 4 — Create a New Project Using VSCode ESP-IDF Extension
Other way you can just use the VSCode ESP-IDF Extension to create the project also . Follow the below steps
- Click on the ESP-IDF Icon in the VS Code sidebar
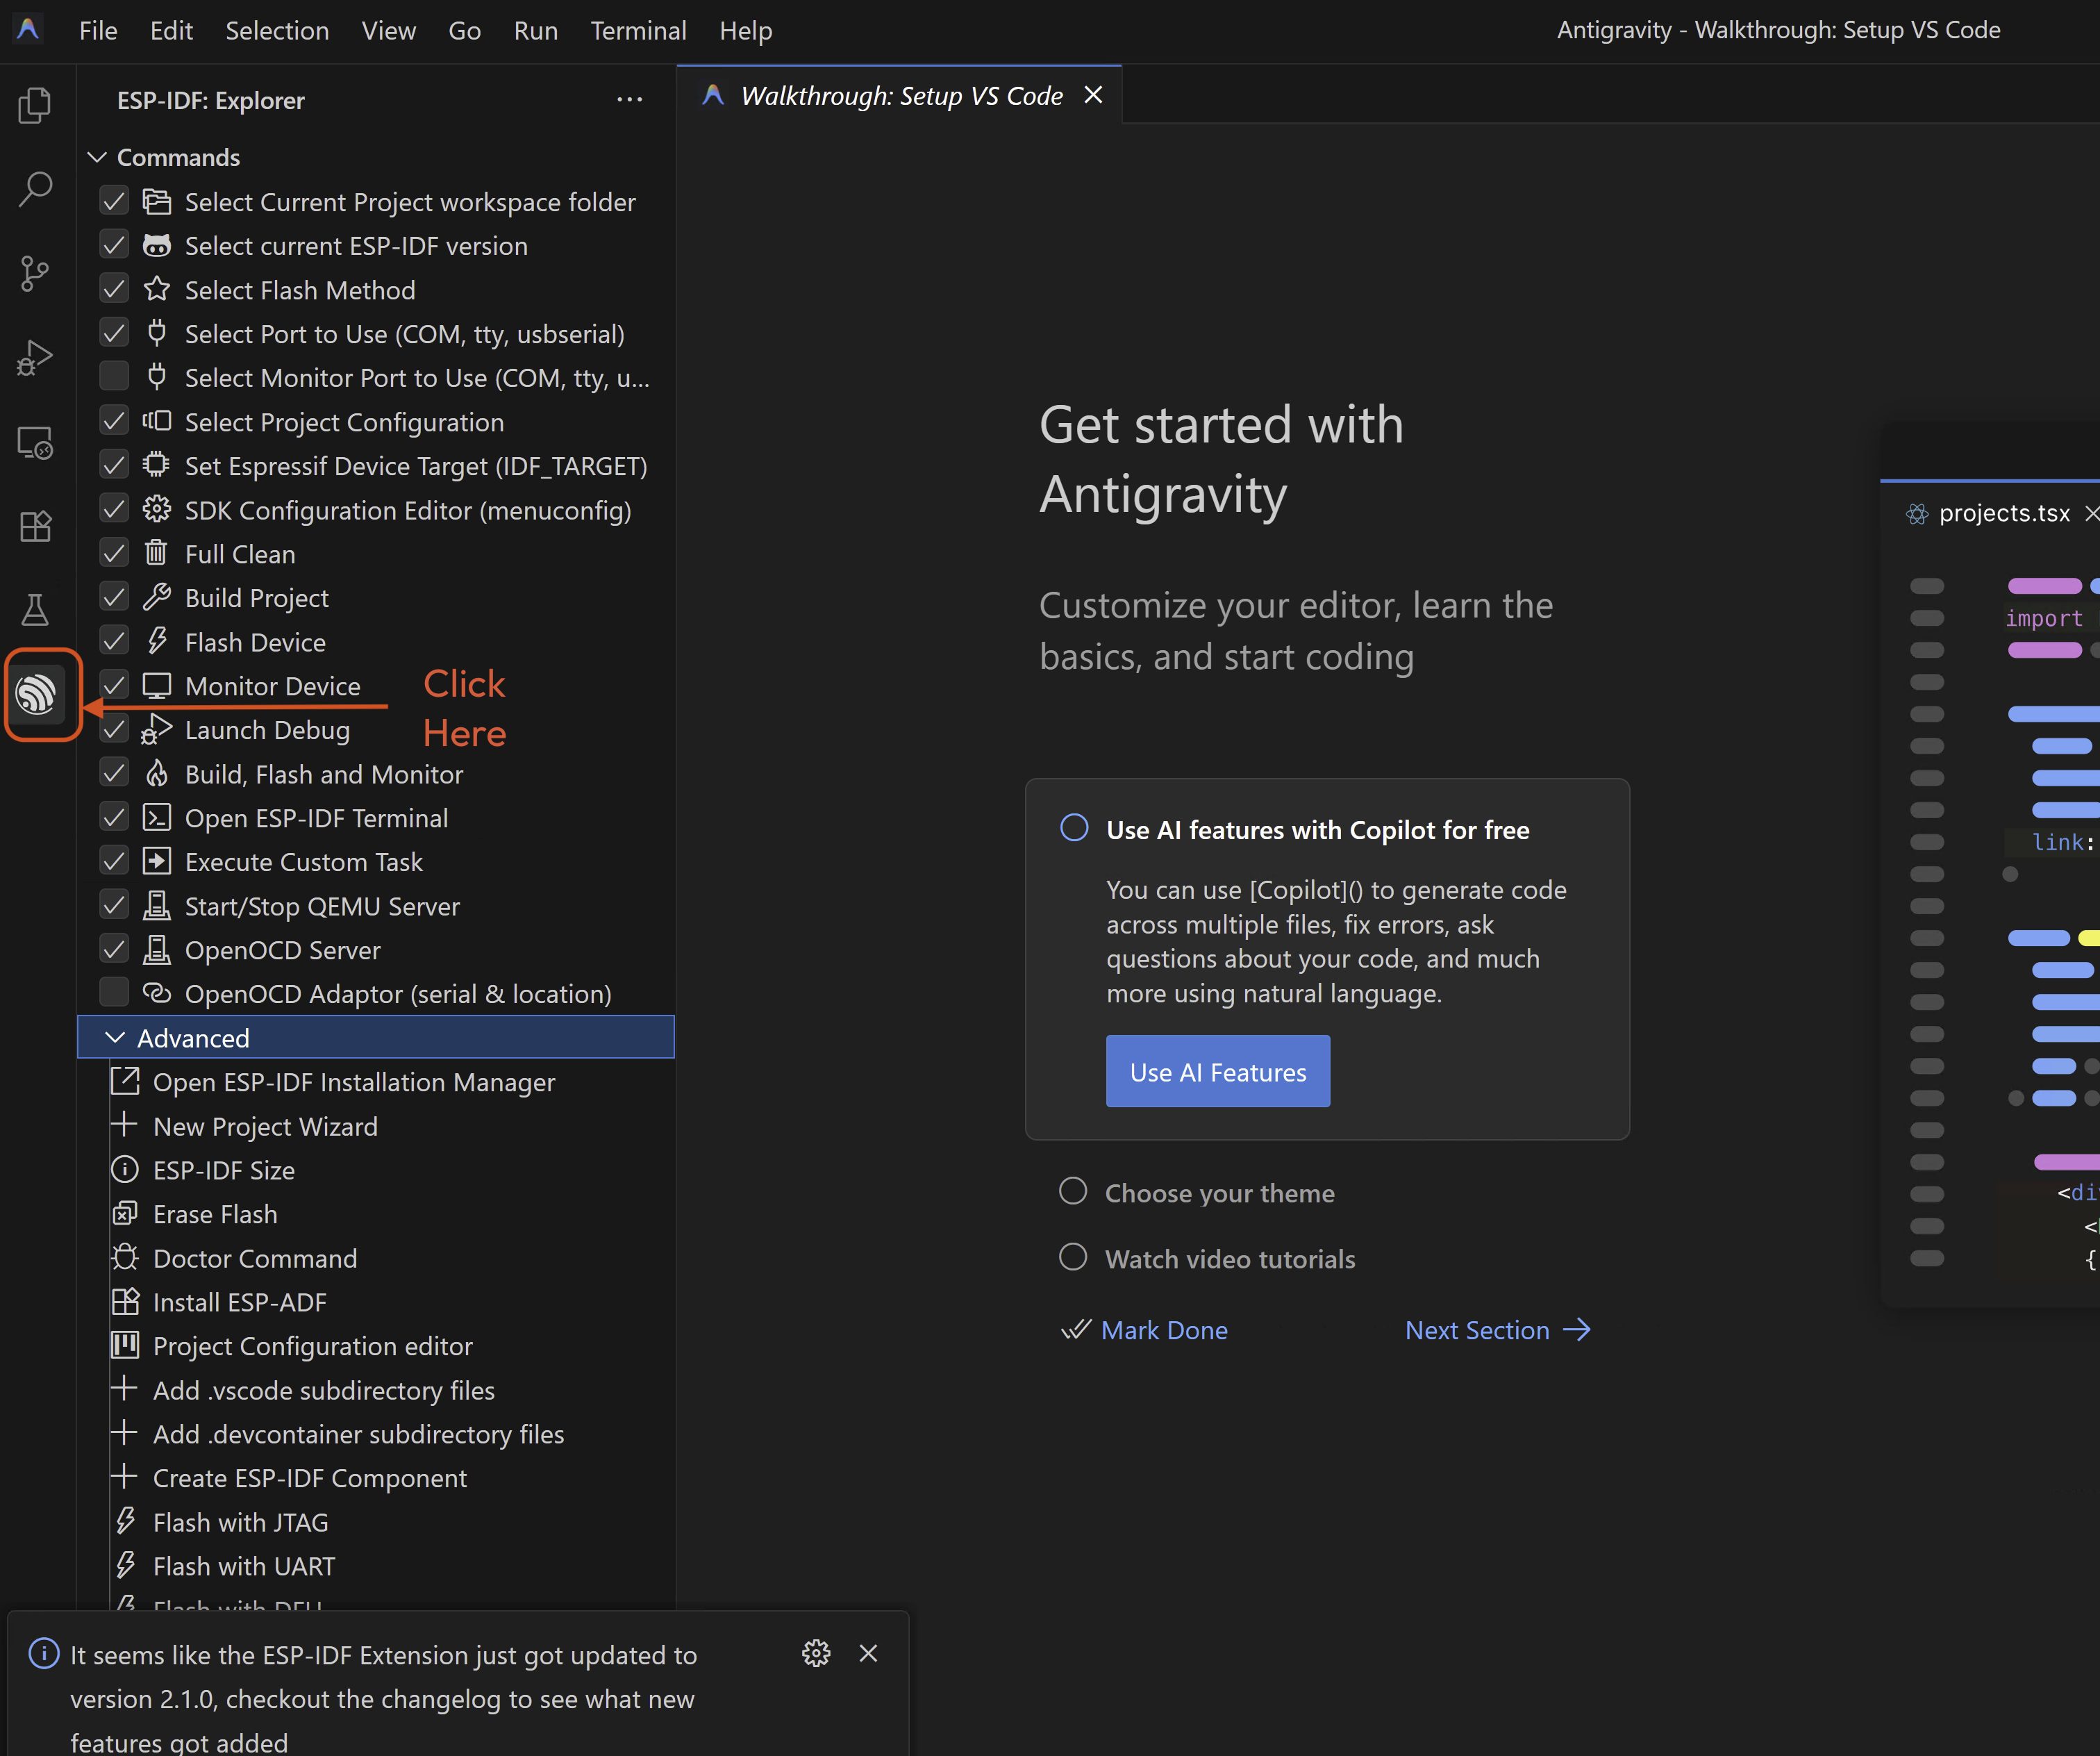
- Click on New Project
- Select a template — use
get-started/hello_worldfor a basic test
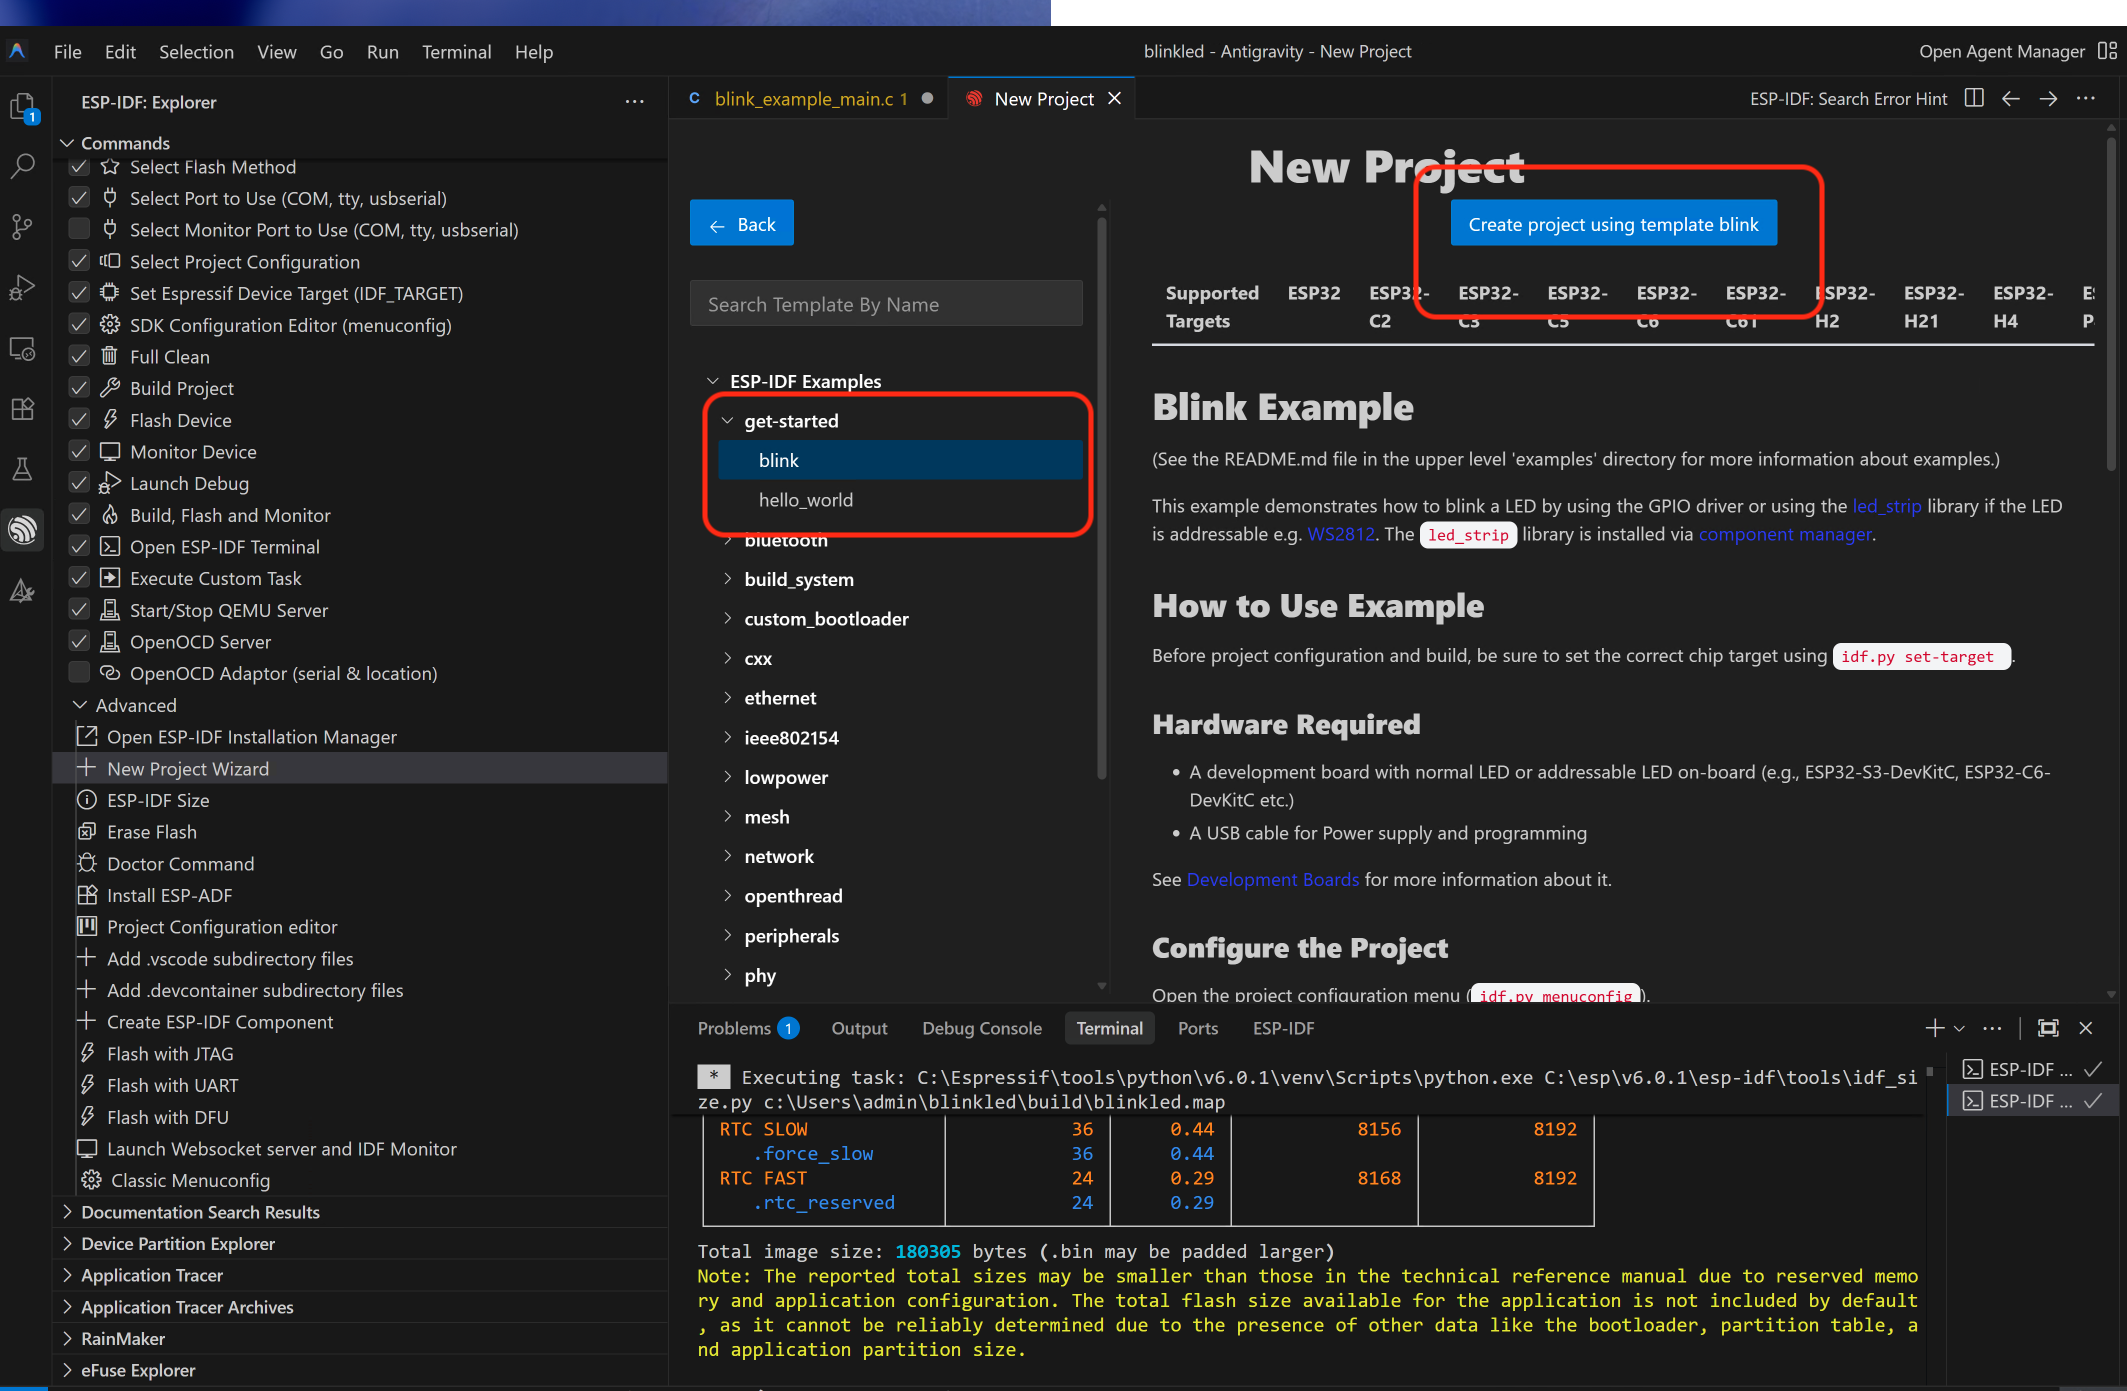 4. Set project name, location (no spaces in path), and target chip
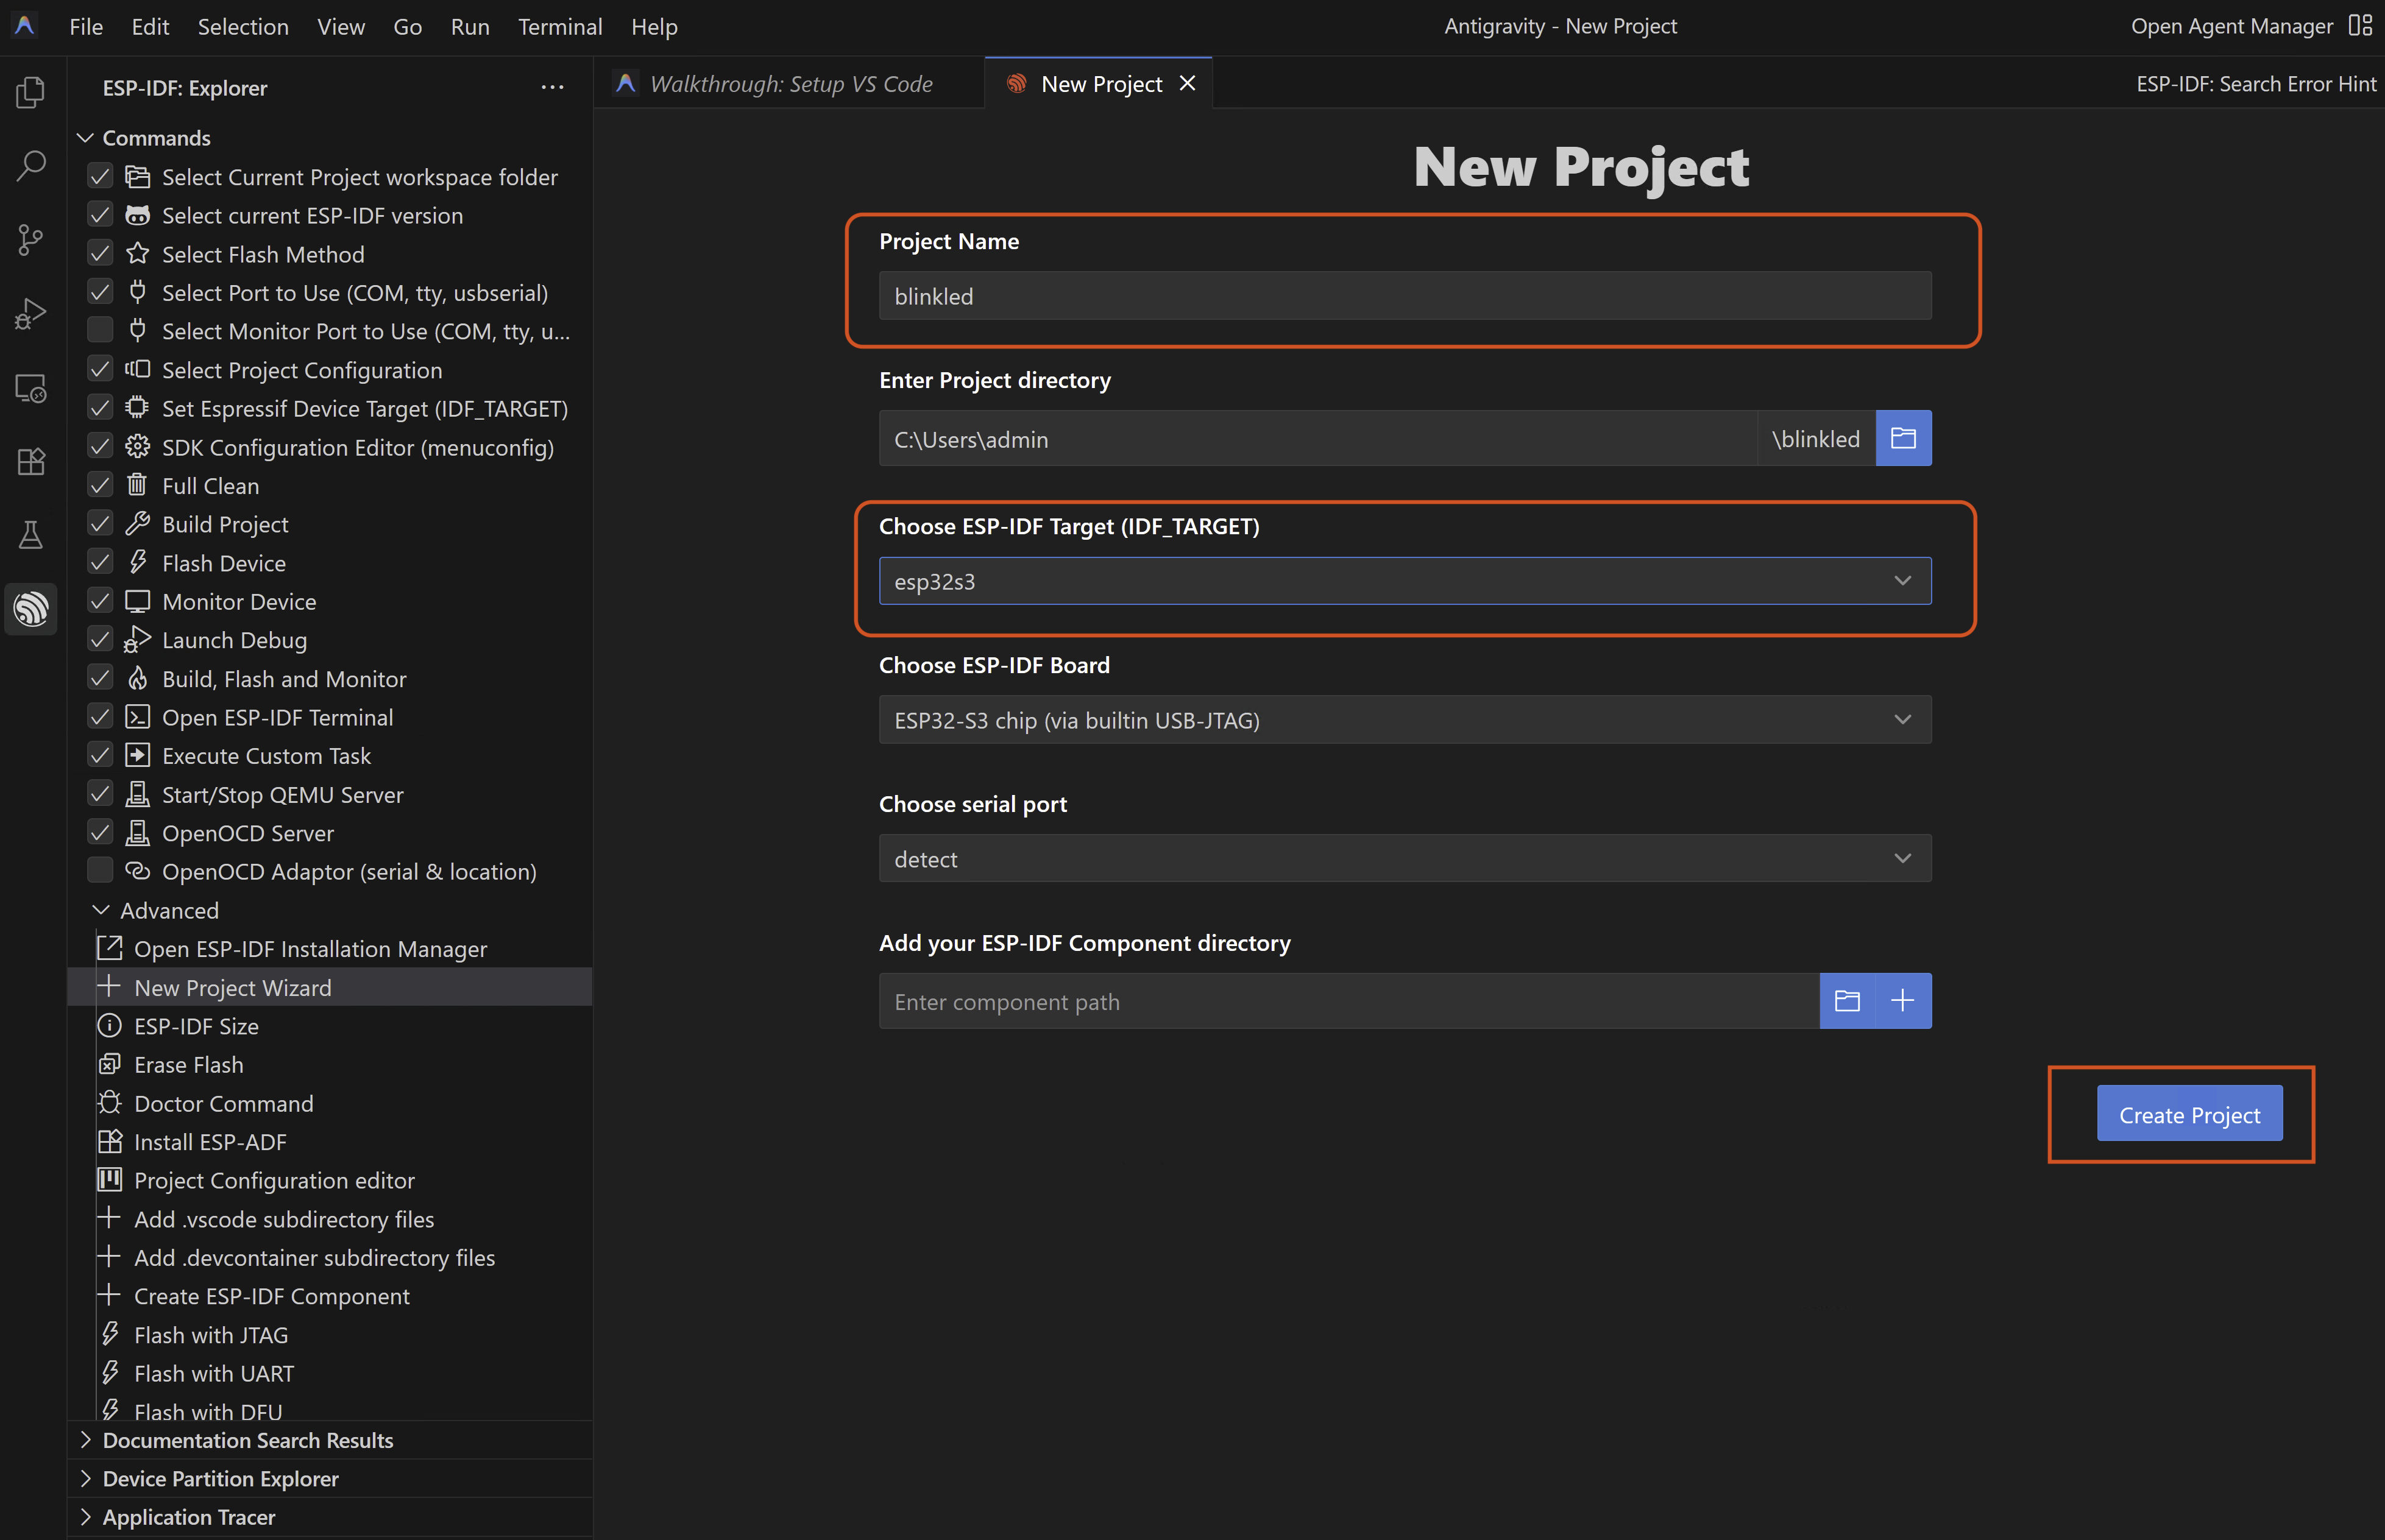
- Click Create Project → Open Project
Step 5 — Set the Target Chip
Open the Command Palette and run:
ESP-IDF: Set Espressif Device Target
Select your chip — esp32, esp32s3, esp32c3, or esp32c6.
You can also click the target chip name in the VS Code status bar at the bottom to change it quickly.
Step 6 — Select the Serial Port
Click the serial port icon in the VS Code status bar, or run:
ESP-IDF: Select Port to Use
Choose your board's COM port from the list — e.g., COM3.
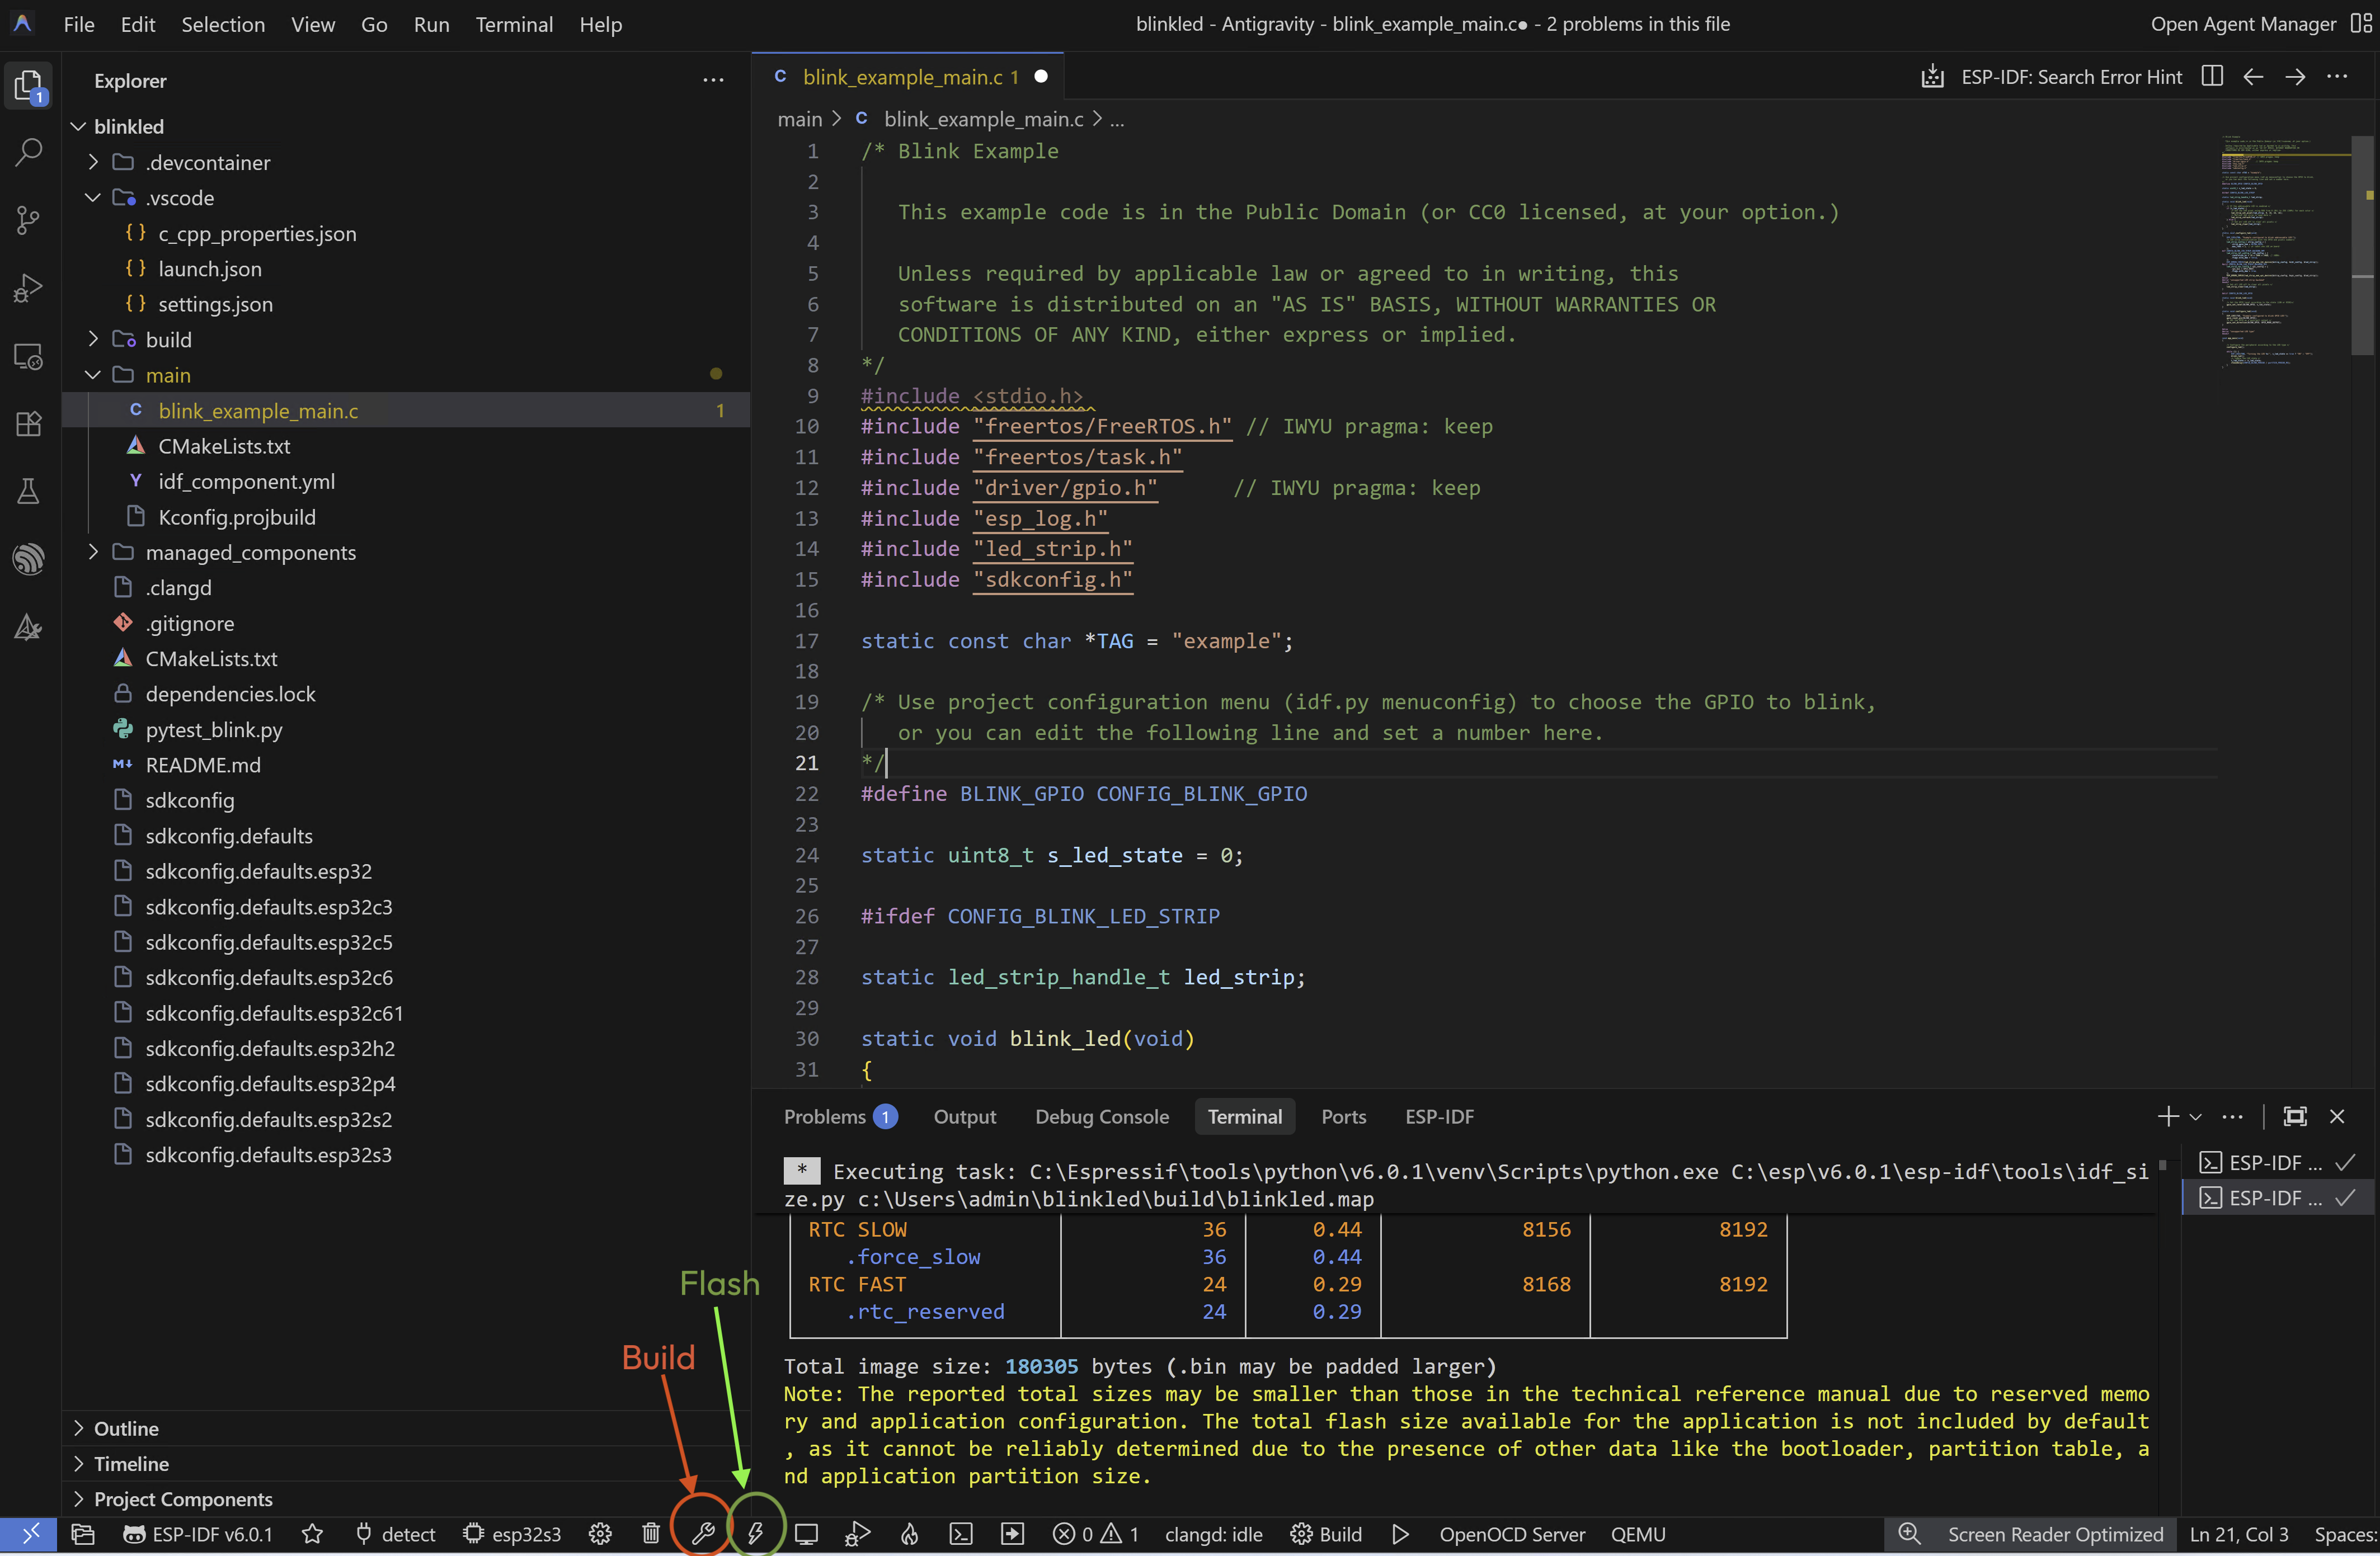
Step 7 — Build, Flash and Monitor
Use the status bar buttons or the Command Palette:
| Action | Command Palette | Status Bar |
|---|---|---|
| Build | ESP-IDF: Build your Project | 🔨 Build |
| Flash | ESP-IDF: Flash your Project | ⚡ Flash |
| Monitor | ESP-IDF: Monitor your Device | 🖥 Monitor |
| Build + Flash + Monitor | ESP-IDF: Build, Flash and Monitor | 🔥 |
Use UART for flashing
When prompted to select a flash method — always choose UART for standard ESP32 boards. JTAG is for advanced debugging only.
Keyboard Shortcuts
| Action | Windows/Linux |
|---|---|
| Build | Ctrl+E B |
| Flash | Ctrl+E F |
| Monitor | Ctrl+E M |
| Build + Flash + Monitor | Ctrl+E D |
| Exit Monitor | Ctrl+] |
Step 8 — IntelliSense and Code Navigation
After building once, VS Code has full IntelliSense for all ESP-IDF APIs:
- Auto-complete for all IDF functions —
gpio_set_level,esp_wifi_init,xTaskCreate, etc. - Go to definition (
F12) — jump directly to ESP-IDF source - Hover documentation — see function signatures and descriptions inline
- Error highlighting — build errors shown in the editor before you compile
IntelliSense takes a moment
After opening a project for the first time, IntelliSense needs a few minutes to index all ESP-IDF headers. A spinning icon appears in the bottom right corner — wait for it to finish before expecting full autocomplete.
If IntelliSense is not working after building, regenerate the configuration:
- Press
Ctrl+Shift+P - Type
ESP-IDF: Add .vscode Configuration Folder - Run the command — this recreates
c_cpp_properties.jsonwith correct include paths
Step 9 — Menuconfig (Project Configuration)
To configure project-specific settings — WiFi credentials, FreeRTOS tick rate, log levels, partition tables:
- Press
Ctrl+Shift+P - Type
ESP-IDF: SDK Configuration Editor - Run the command
A graphical menuconfig interface opens inside VS Code. This is easier to use than the terminal version.
Manage ESP-IDF Versions from VS Code
The extension integrates with EIM directly. To manage your installations:
Open Command Palette → ESP-IDF: Open ESP-IDF Installation Manager
This launches EIM inside VS Code where you can:
- Install additional ESP-IDF versions
- Switch between versions for different projects
- Update or repair an existing installation
Debugging with JTAG (Advanced)
Requires JTAG hardware
JTAG debugging requires either a dedicated JTAG probe (e.g., ESP-Prog, J-Link) or an ESP32 board with built-in USB-JTAG (e.g., ESP32-S3 DevKitC, ESP32-C6 DevKitC). Standard ESP32 DevKit boards do not have built-in JTAG — skip this section if you are using a standard board.
- Connect your JTAG probe to the board's JTAG pins
- Open the Run and Debug panel —
Ctrl+Shift+D - Click "Create a launch.json file" → select "ESP-IDF Debug"
- Press
F5to start a debug session
You can set breakpoints, inspect variables, watch memory regions, and step through code line by line.
Recommended Extensions
Install all of these for the best ESP-IDF development experience in VS Code:
| Extension | Publisher | Purpose |
|---|---|---|
| ESP-IDF | Espressif Systems | Core ESP32 development |
| C/C++ | Microsoft | IntelliSense, syntax highlighting |
| CMake Tools | Microsoft | CMake project support |
| Serial Monitor | Microsoft | Better serial terminal |
| GitLens | GitKraken | Git history and blame |
Troubleshooting
Extension not detecting ESP-IDF
Run ESP-IDF: Doctor Command. Then run ESP-IDF: Select Current ESP-IDF Version and manually select your v6.0.1 installation.
COM port not visible
Make sure USB drivers are installed (CP210x or CH340), board is connected, and no other application is using the port. Unplug and replug the board.
IntelliSense errors but build works fine
Run ESP-IDF: Add .vscode Configuration Folder to regenerate include path configuration.
Flash fails — port access denied
Close Arduino IDE, PuTTY, or any serial monitor using the same COM port.